Reports
See what parts cost and where they went, by category, location or tag, for any date range, with the bill-back beside it, and export it as a CSV.
Reports answers one question: where did our parts go, and what did they cost? It adds up what was taken out of stock, puts a cost on it, and groups it the way you choose.
Reports are part of the Pro plan, and only owners and managers can see them. They show what parts cost, so they stay with the people who run the budget. Techs and viewers do not see Reports in the menu, and if they open the address they see a note that reports are for owners and managers. On Essentials, Reports is marked Pro and opens a short note. See Your plan.
What you'll need#
- The Pro plan, and the Owner or Manager role.
- A signal. Reports are worked out when you open them, so they are not available offline.
- Parts that have been taken out of stock. A company with no takes yet shows "Nothing was taken in this range".
- Costs on your items. Spend is only as good as each item's Unit cost. See Items.
Steps: read the spend by category, location or tag#
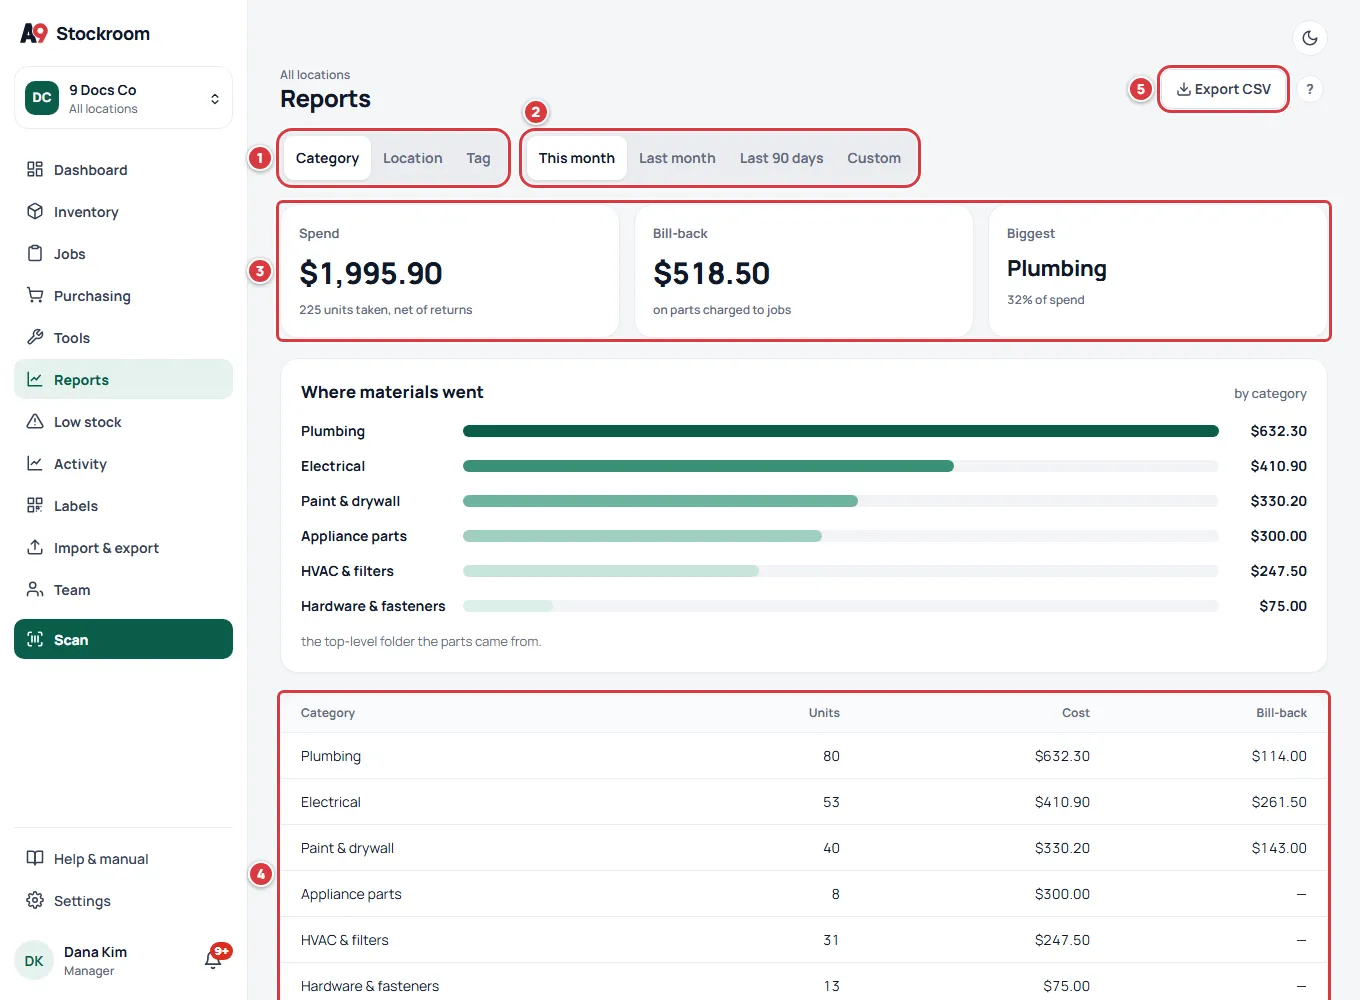
- Open Reports. On a computer, choose Reports in the left menu. On a phone, open Settings, then Reports.
- Choose a view with the first row of buttons: Category, Location or Tag. If your company calls its locations something else, such as Site or Store, that word is on the button instead of Location.
- Choose a date range with the second row of buttons. It starts on This month.
- Read the three numbers at the top: Spend, Bill-back and Biggest.
- Read the bars and the table. The bars show the biggest rows. The table lists every row with Units, Cost and Bill-back, and a Total at the bottom.
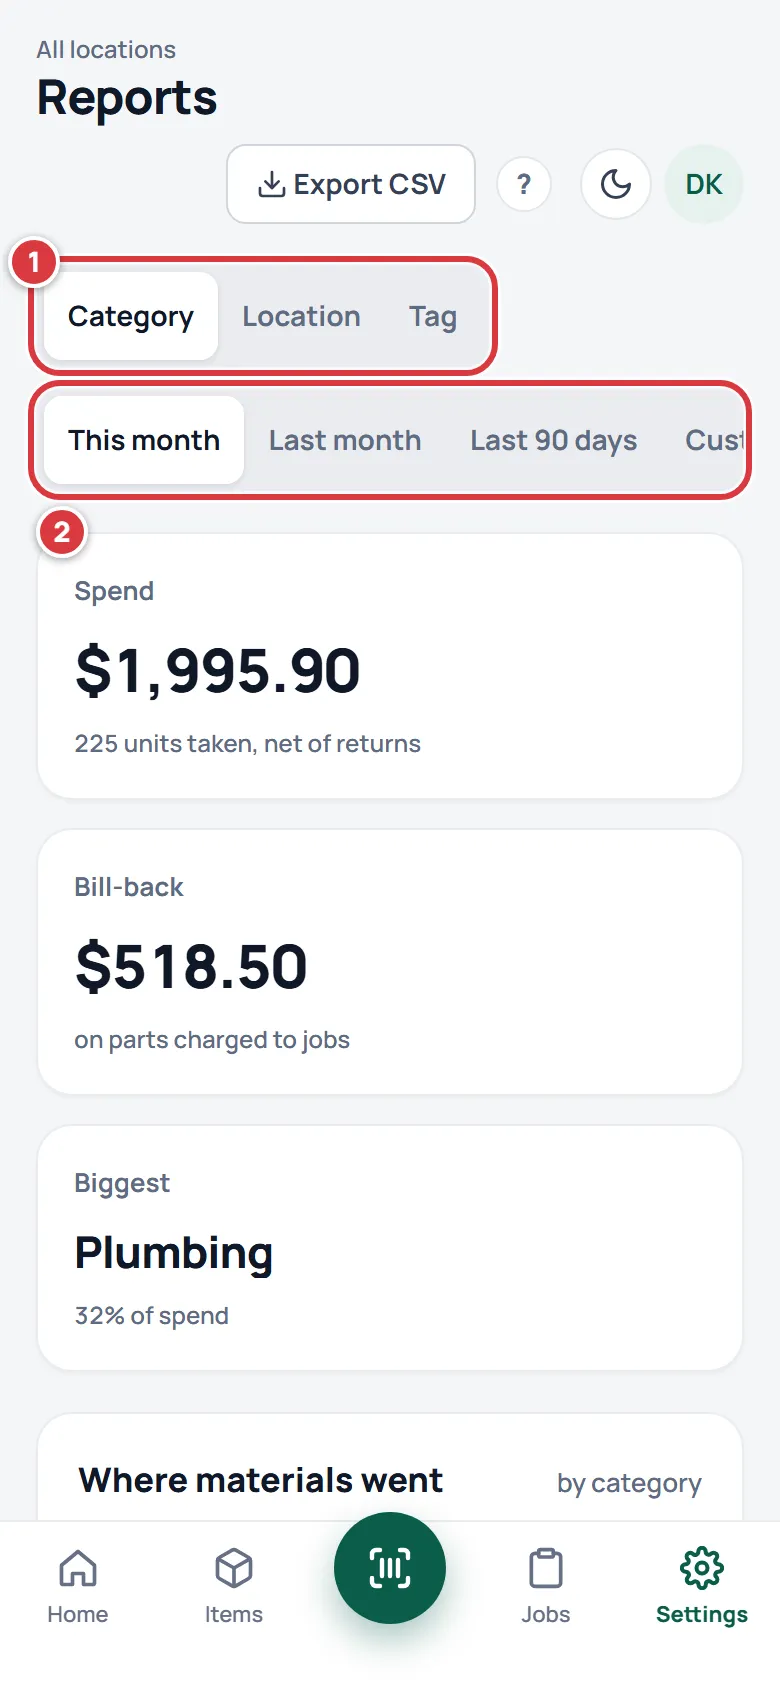
On a phone the same numbers stack in one column, with the bars and the table below.
What each view groups by#
- Category: the top-level folder the parts came from. A part taken from Plumbing > Toilets > Bin P-03 counts under Plumbing. Parts with no folder show as "No folder".
- Location: the location the part was taken from. See Locations.
- Tag: the tags on the item. An item with two tags counts once under each, so the rows can add up to more than the Total. Items with no tags count under "Untagged".
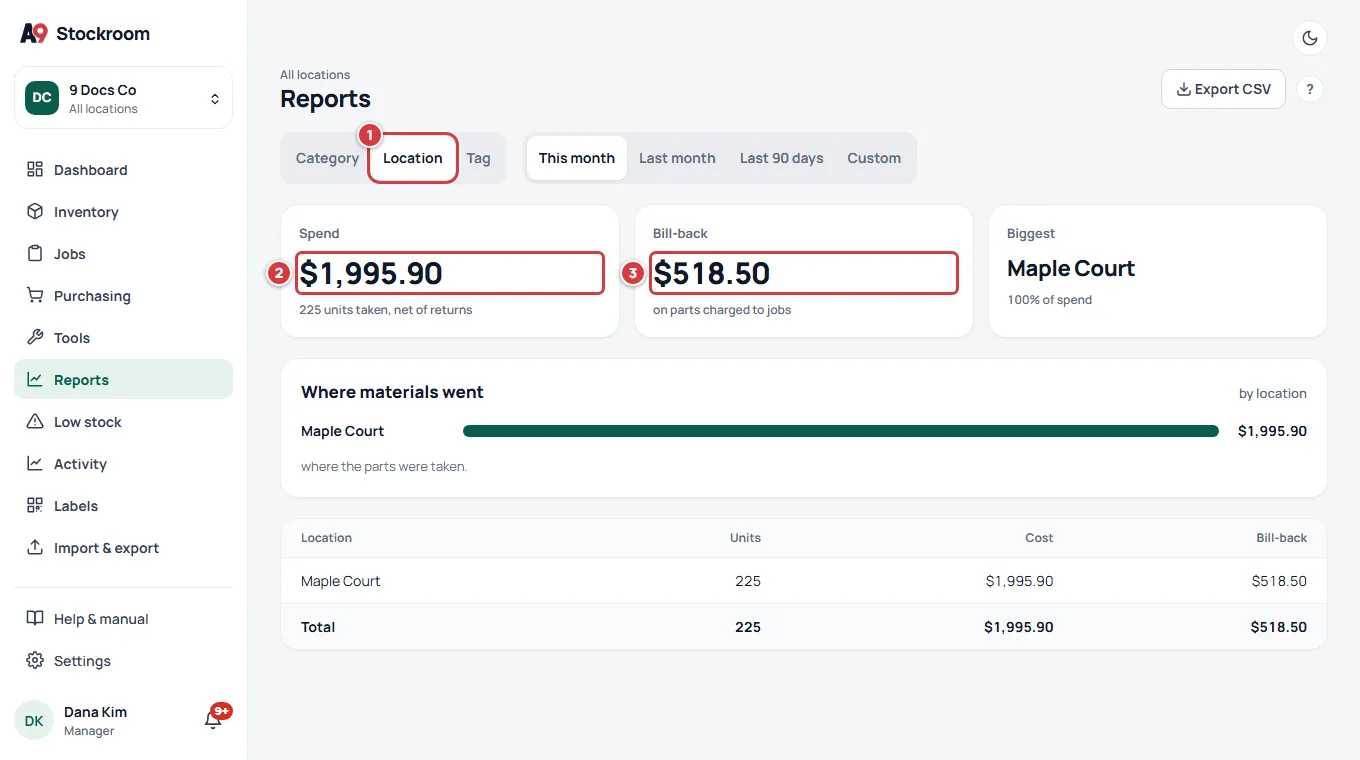
If you picked a location in the location switcher, the report covers only that location. With All locations chosen, it covers every location you can see. The small line above Reports says which.
Unit turns, for companies that use the word Property#
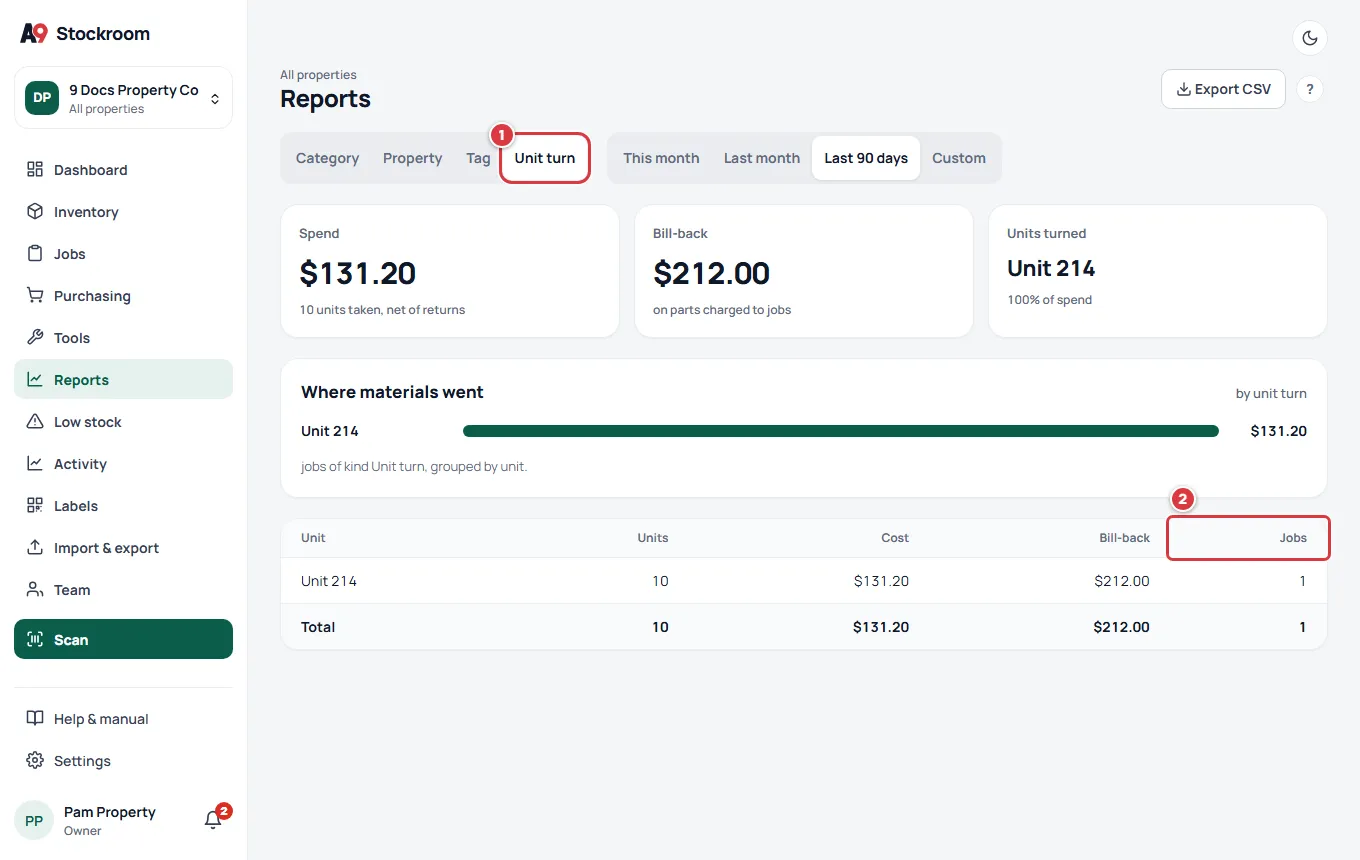
A company whose word for a location is Property gets a fourth view, Unit turn. It lists the jobs of kind Unit turn and groups them by unit, such as Unit 214, with a Jobs column that counts how many jobs. The first number then reads Units turned instead of Biggest. Companies that use any other word do not see this view. See Jobs.
Steps: change the date range#
- Tap This month, Last month, Last 90 days or Custom.
- For Custom, set From and To. The report shows both days and everything between. From must be on or before To, or you see "Pick a start date that is on or before the end date."
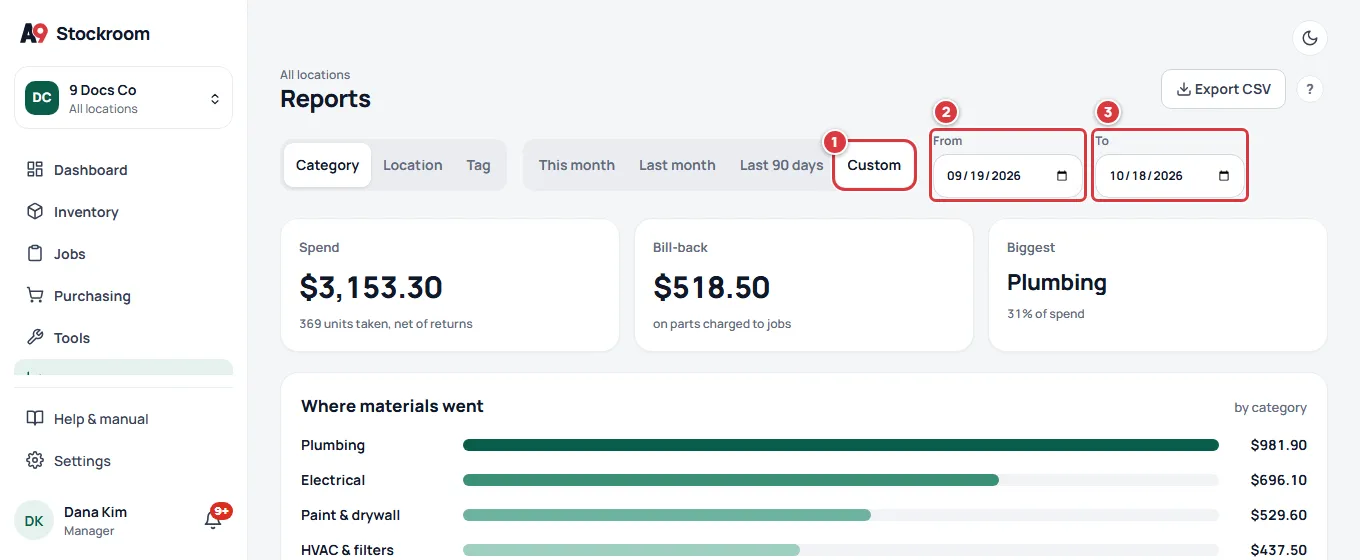
What each range means:
- This month: the 1st of the month up to now.
- Last month: the whole of the month before.
- Last 90 days: today and the 89 days before it.
- Custom: the days you pick.
Days are counted in your company's time zone, so a take just after midnight there falls on the new day. The owner sets the time zone in Company settings. See Company settings.
Steps: export a report as a CSV#
- Choose the view and the date range you want.
- Tap Export CSV. It is at the top right.
- Open the downloaded file in a spreadsheet.
The file matches what is on the screen: one row per line of the table with Units, Cost and Bill-back (and Jobs for Unit turn), then a Total row. Its name says the view, for example spend-by-location.csv. The button shows once the report has loaded.
What you'll see#
- Three numbers: Spend, Bill-back and Biggest (Units turned in the Unit turn view). Biggest names the top row and what share of the spend it is.
- A chart, Where materials went, with a bar for each of the biggest rows (the top eight).
- A table with every row, biggest cost first, and a Total.
- A dash in Bill-back where nothing was charged to a job.
What spend means#
- Spend is the cost of what was taken out of stock, minus what was returned, in the date range.
- It is worked out as units times each item's Unit cost, as it is today. If you change an item's cost, reports for earlier dates use the new cost too.
- Only takes and returns count. Receiving, counting, moving and transferring stock do not change spend, and neither does stock that is sitting on the shelf.
- A take counts whether or not it was for a job.
- The note under Spend reads, for example, "225 units taken, net of returns".
Bill-back next to cost#
Bill-back is what you can charge on. It uses the same units as Spend, but at each item's Bill price instead of its cost, and only for parts taken for a job. Parts taken with no job add nothing to it. Where a job's parts were not billed, the table shows a dash.
The gap between Bill-back and the cost of the same parts is your markup on those jobs. Spend is across everything taken. See Jobs for how a job collects parts and shows its own Billable to total.
If it didn't work#
Reports is not in the menu#
Reports are for owners and managers on the Pro plan. Check your role under Team and your plan under Plan. See Roles and permissions.
"Nothing was taken in this range"#
No parts were taken in those dates, or they were all returned. Try Last 90 days, or switch the location switcher to All locations. Start a job and take a part for it to see numbers.
The numbers are lower than I expected#
Check the location switcher: a single location shows only that location. Also check the date range, and that the parts have a Unit cost other than 0.
A part from one location counts under another#
A take is counted at the folder it came from. Check the folder's location.
The Tag rows add up to more than the Total#
That is correct: an item with two tags counts under both.
There is no Unit turn button#
That view is only for companies whose word for a location is Property.
"Pick a start date that is on or before the end date."#
Set From earlier than To.
The cost of old takes changed#
Reports use each item's current Unit cost. Change the cost back, or accept that past reports follow it.
Export CSV is missing#
It only shows once the report has loaded. If the screen is still loading, or shows a problem, wait or tap the retry button, and check your signal.